

ISBN : 978-81-19084-72-2
Category : Academic
Catalogue : Computer
ID : SB20501
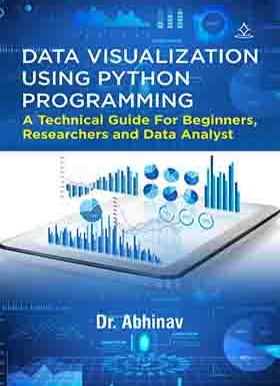
Data Visualization using Python Programming-
A Technical Guide For Beginners, Researchers and Data Analyst
Dr.Abhinav
Paperback
550.00
e Book
450.00
Pages : 172
Language : English
12 Copies sold till date
About Book
The book "Data visualization using Python Programming " is a technical guide that uses the Matplotlib Python library for data visualization. The author of this book draws on his experience in data science and provides a comprehensive guide to using Matplotlib for data visualization. The book covers a wide range of topics, including the basics of Matplotlib, creating different types of plots and charts, customizing plot appearance, and advanced data visualization techniques. Throughout the book, the author provides clear explanations of the concepts and techniques involved in data visualization with Matplotlib, along with numerous examples and code snippets to help readers understand how to use the library effectively. He also includes practical tips and best practices for data visualization, based on his experience working with real-world data. Overall, "Data Visualization using Python Programming-A technical guide" is an excellent resource for anyone looking to learn how to use Matplotlib for data visualization, whether they are new to the library or have some experience with it already. The author has given simple and clear explanations of various examples, making the book accessible and useful for a wide range of readers.
Customer Reviews

